What happened to the volume and value of cash in circulation?
Dr Simon Jones, Head of Data Analytics, De La Rue Currency
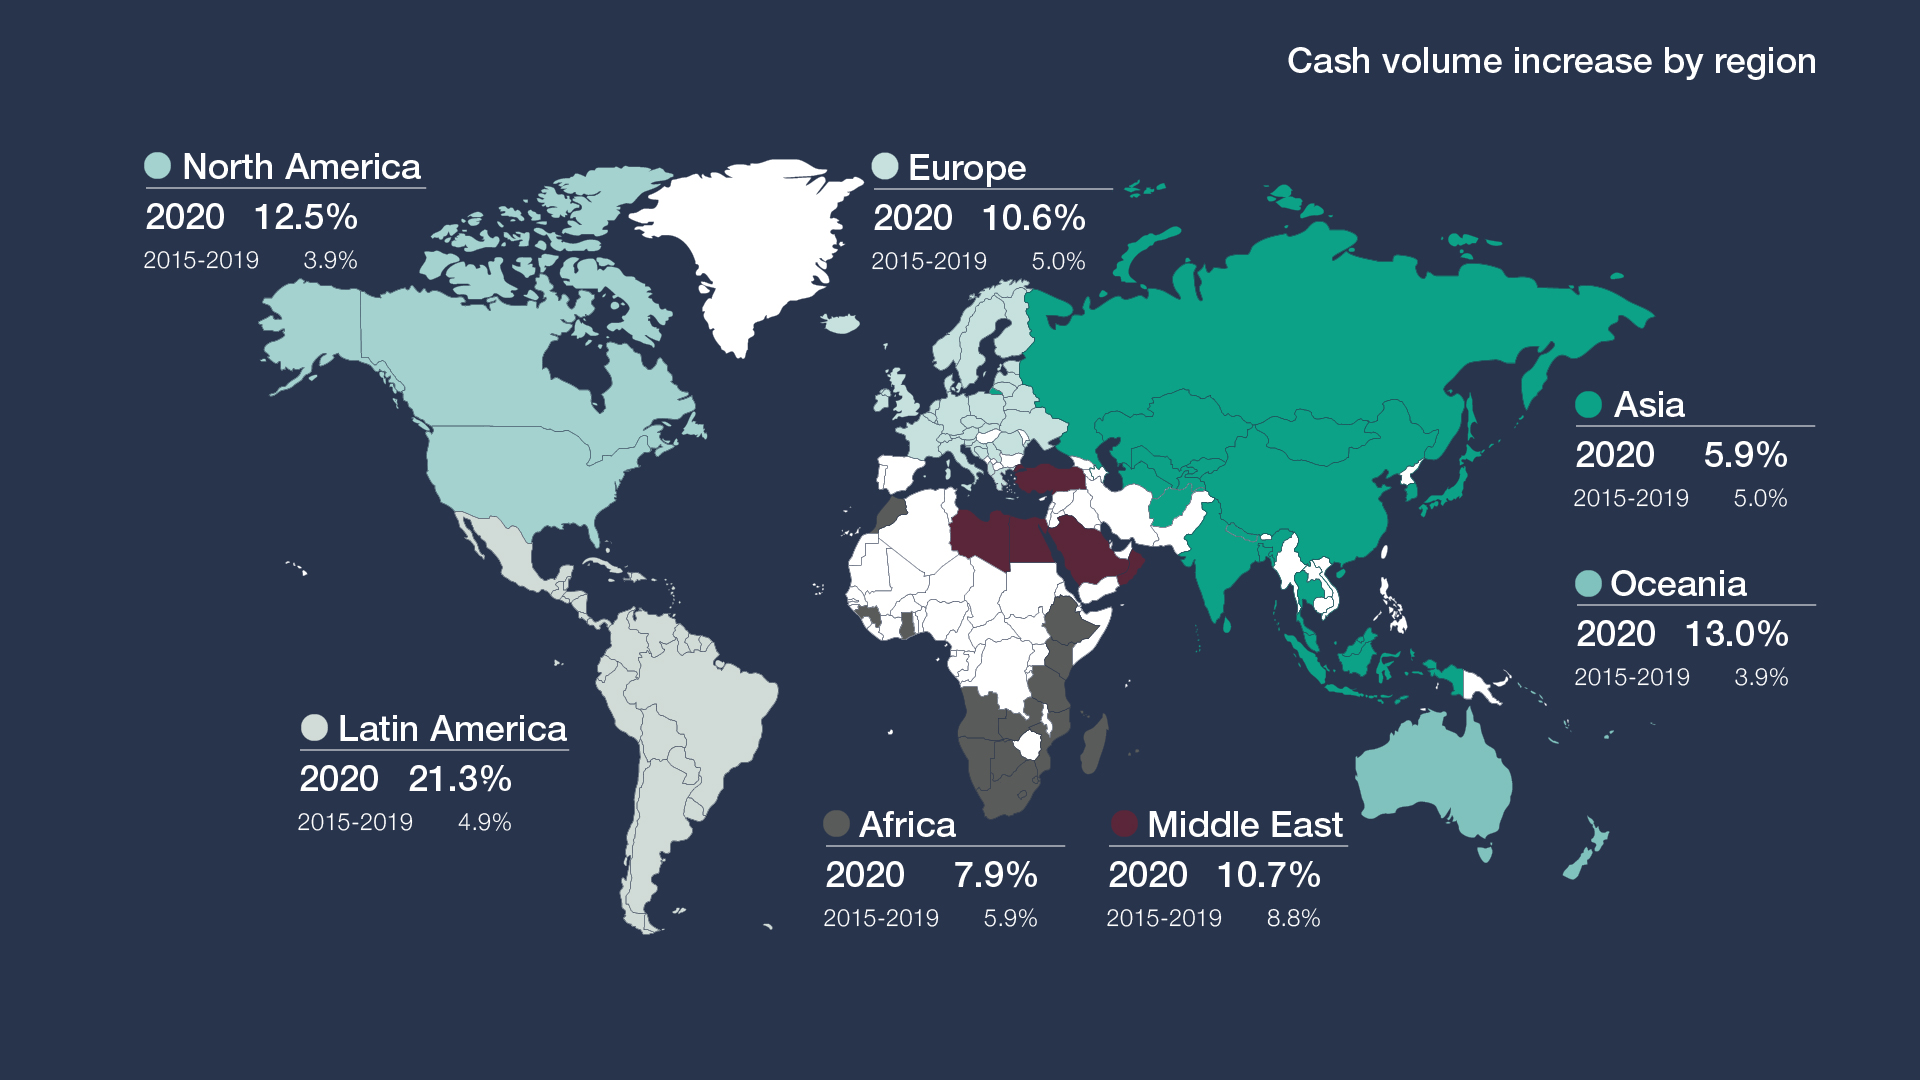
The way that we used cash during the early peaks of the COVID pandemic saw an abrupt change. There was an acceleration toward the digitalisation of payment methods whilst simultaneously the demand for cash grew. At first glance this increase in demand for competing payment methods may seem paradoxical, why would there be more demand for cash when we are paying for goods and services using cashless alternatives?
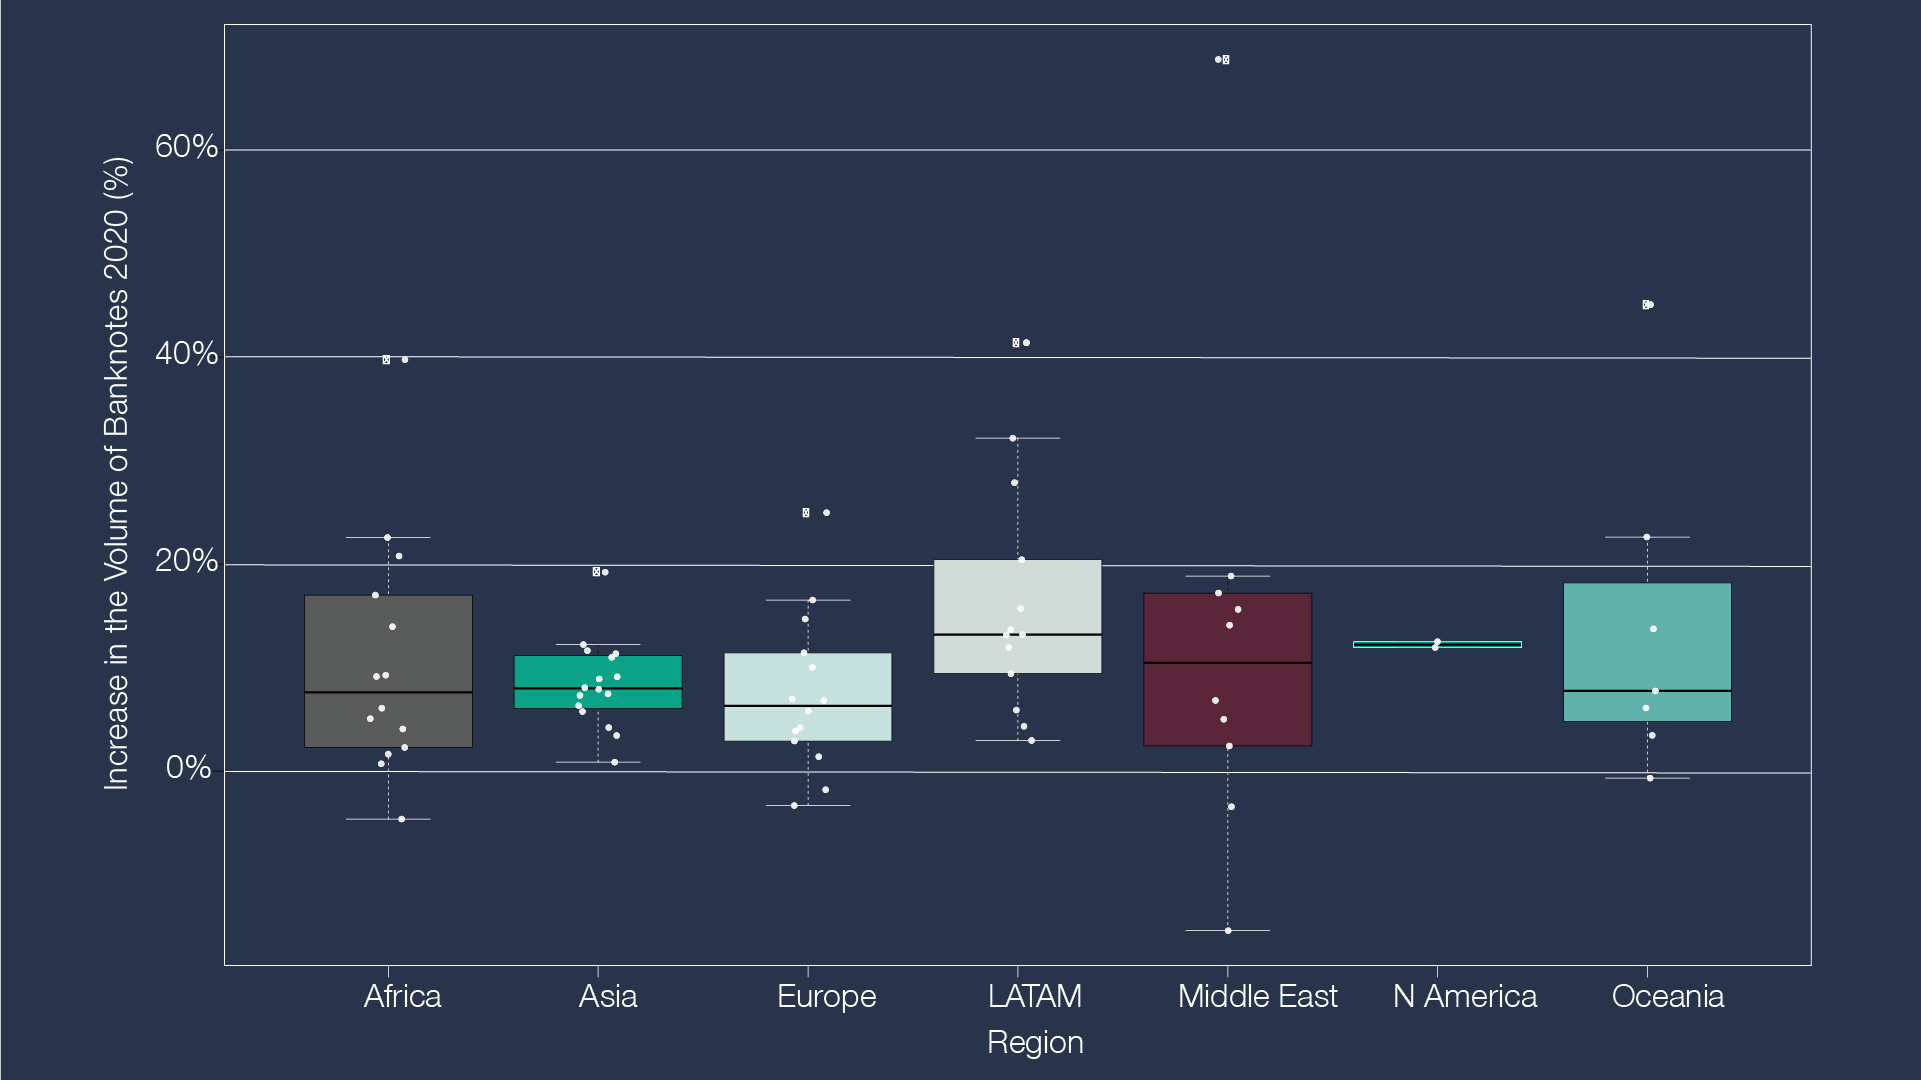
We looked at how cash volumes and the value of cash in circulation changed and identified some patterns using publicly available data from seventy-six central bank annual reports, statistical bulletins and data from online data warehouses.
Volumes


Values
Most countries provide the IMF with International Financial Statistics (IFS). The value of currency in circulation is one of these many statistics. The value of currency from one country is not directly comparable to another country therefore a useful measurement is to define the value of currency at a date to be an index of 1 and then measure the growth from that time.
Value of cash in circulation in 2020


- India's demonetisation in 2016 significantly impacted the value of cash in circulation, along with the bounce back to expected values soon after.
- Sweden and Norway continued their move toward a "less-cash" society.
- Ghana saw the most rapid increase in the demand for currency in 2020 (Figure 3). However, the more recent depreciation has likely been caused by an increased demand for foreign currencies as most businesses are now recovering from the COVID-19 shock. This is not limited to Ghana.
- China and Japan are countries which were least impacted by COVID-19 with respect to currency in circulation. China experienced an increase at the beginning of 2020 yet returned to the original trajectory within a few months.
- In Europe, Poland, Romania and the European Central Bank have experienced increased demand for value of currency in circulation and this should be expected to continue following the recent events in the Ukraine.
- The Middle East shows substantial volatility in the value of currency across the region.
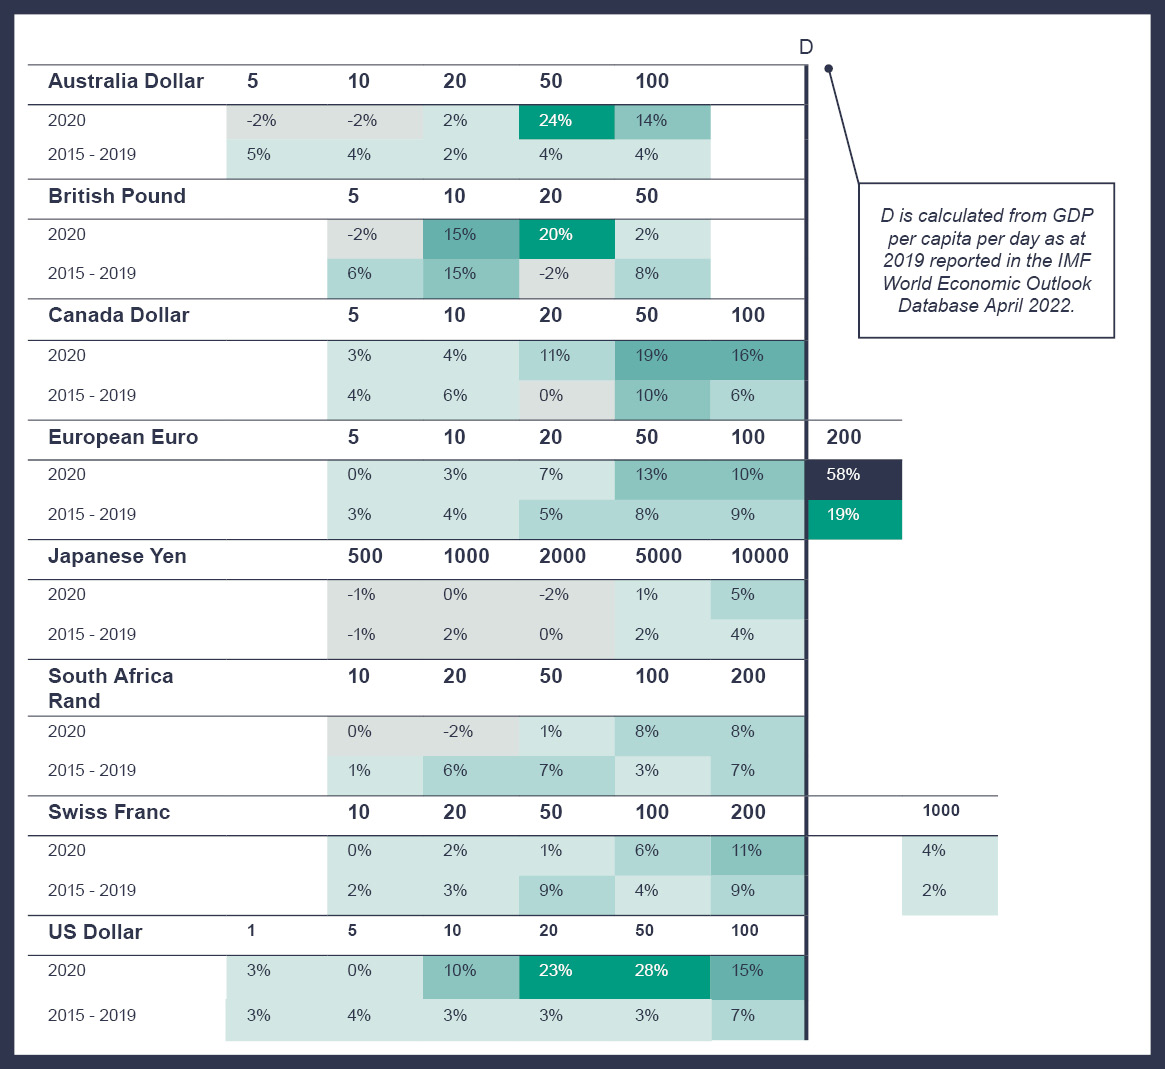
Impact across denominations

- The US Dollar denominations increased significantly for the 20 & 50, followed by the 10 and 100 denominations over the previously observed rate.
- The European Euro volume increased significantly, peaking with the 200. (This denomination is also impacted as a direct result of removing the 500 from circulation.)
- The Japanese Yen continues to grow in the 10,000 Yen, which now represents 93% of value in circulation. The lower denominations saw a decrease in the volume in circulation. The increase of the 10,000 was only 5%.
- The Swiss Franc observed an increase over 10% for the 200 Franc.
- The Canadian Dollar observed a significant increase in the 50 and 100 Dollar.
- Similarly, the Australian Dollar has seen significant increases in the 50 and 100. The lowest denominations have decreased in the volume in circulation.
- There were no increases over 10% in South Africa, although the 100 and 200 Rand had increased above the previous observed rate.
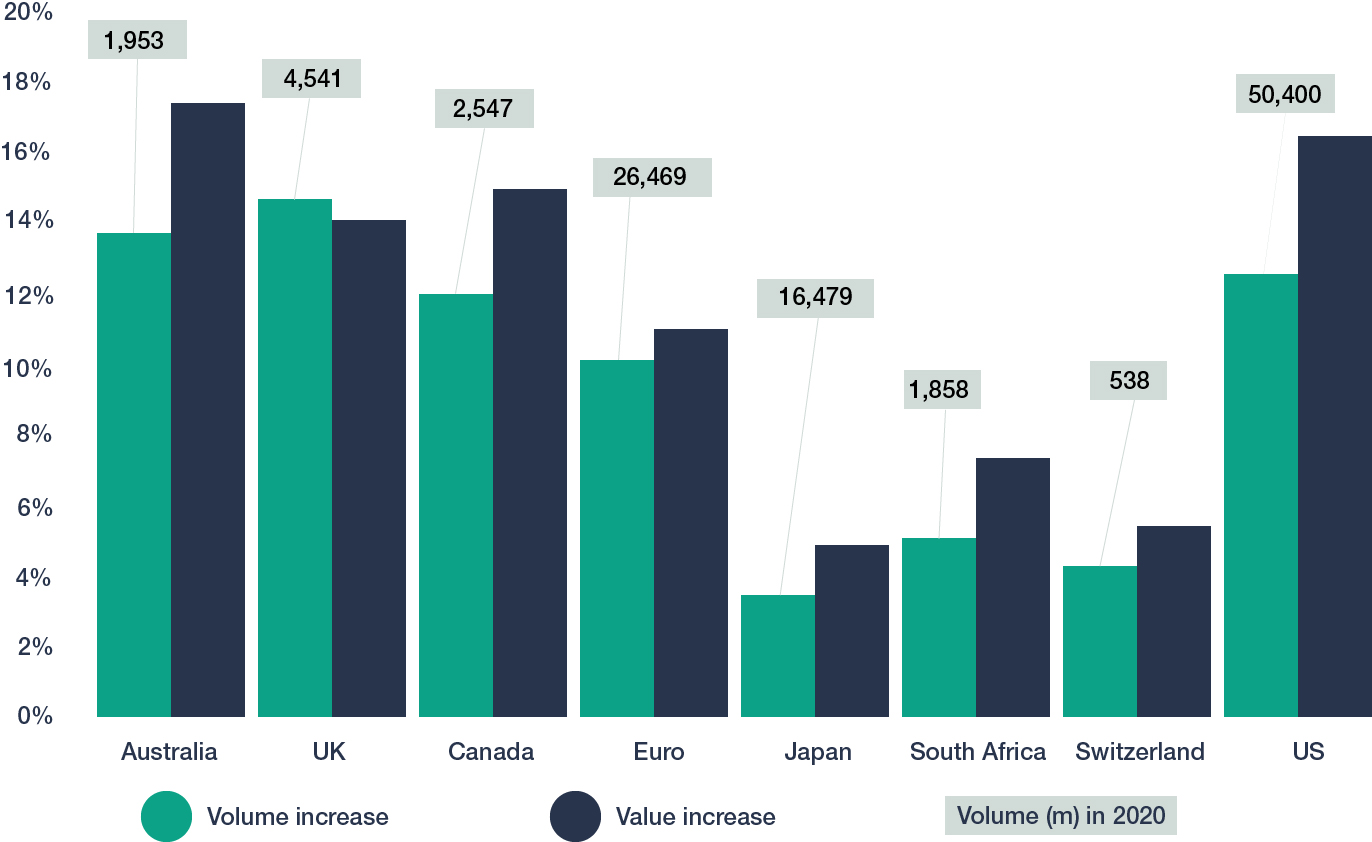
Volume and Value increase by currency


