• Search
    • There are no suggestions because the search field is empty.
    dlr_analytics
    Data-driven insights to put you in control of your cash cycle.
    Join other central banks in using this multi-award winning service to make evidence-based decisions for a better-managed, more efficient and more cost-effective cash cycle.

    Tap into a wealth of aggregated data. 

    DLR Analytics™ is the leading cash cycle analytics service, providing a free toolkit that enables central banks to benchmark their cash cycle performance, simplify monthly reporting and make evidence-based decisions about their cash cycle.

    DLR Analytics™ is simple to use and uses data that most central banks routinely collect or publish online. The toolkit incorporates the most popular central bank mathematical models for banknote demand forecasting and cash cycle analytics. This allows users of DLR Analytics™ to focus on the outcome of analysis, assured they are using standardised and approved models, instead of focusing on which mathematical tool is best for their needs.

    Since its launch in 2017 DLR Analytics™ has progressed to incorporate advanced forecasting tools. The platform enables central banks to model scenarios related to cash in circulation, new banknote demand and stock run down dates. Advanced algorithms automate recommendations or users can overlay with their own predictions, incorporating shock events if needed. Aggregated and anonymous user data is also provided to enable central banks to benchmark their cash cycle against regional and global trends.


    Key benefits

    • Informed decision making - Make a better decision about whether a change of substrate is right for you
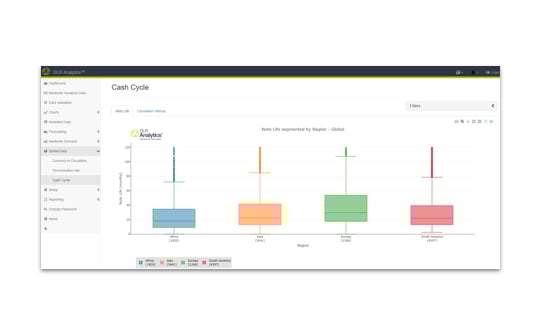
    • Cash cycle visibility - Quantify banknote lifetimes and understand the factors that impact, monitor and capture trends over time
    • Robust demand forecasting - Forecast your future banknote demand using industry standard models and techniques
    • Quantify the impact of decisions - Understand how your different series of co-circulating banknotes compare
    • Simple reporting at a click of a button - Standardised reporting, descriptive statistics, attractive visual representations of your data
    • A supportive community - Analytical support for questions about your cash cycle
    • Data security - Guaranteed security of all your insights
    benefits-1
    benefits-2

    DLR Analytics™ has recently undergone a major upgrade, with improved reporting and treatment of different banknote series


    Email currency@delarue.com for more information or to try the latest software


    award trio small height

    “DLR Analytics provides central banks with an invaluable way of forecasting the future demand for cash - an issue ever-more prevalent, given the rise of digital payments. The software proves substantial value can be taken from simpler aggregated data, reducing the costs for central banks investigating its cash's lifecycle“. 

    Christopher Jeffery
    Chairman of the Central Banking Awards Commitee and Editor-in-Chief of Central Banking

    Our services

    Analytics-1 (1)
    Banknote Lifetime Analysis

    Using steady state mathematical models and frequency distribution curves the DLR Analytics™ service enables banknote lifetimes to be calculated and trends related to banknote lifetime to be monitored. This is ideally suited for measuring the impact of a change in banknote specification, sorters or central bank policy.


    Banknote Demand Forecasting
    Using a range of forecasting tools most commonly used by central banks (based on monthly and annual data), banknote forecasts are generated and evaluated for the value and volume of cash in circulation, by banknote denomination. Advanced DLR Analytics™ users can easily translate this forecast into banknote demand and stock forecasts, using scenario modelling tools that enable replacement rates to be fine-tuned.

    Global and Regional Trend Analysis

    Data is aggregated and anonymsied, meaning that central banks can benchmark their banknote lifetimes and other cash cycle metrics against regional and global norms. Global cash cycle trends are available for those who contribute their DLR Analytics™ data to pooled data and the team periodically produce anonymized case studies.


    D-Metric™ and Denominational Structure Assessments

    Based on an empirical tool, first developed in the 1980s and since used with dozens of central banks, the D-Metric™ assessment is used to highlight how similar a denominational structure is relative to the needs of a country, based on regional and global normal. Forecasting tools can also be applied to indicate the likely impact of changing your denominational structure.

    Get in touch

    Simon Jones

    We are here to answer your questions about this service. Simply get in touch with Dr Simon Jones, Head of Data Science

    A steady track record

    3

    The number of awards won since 2018

    80

    80+ Central Banks who have engaged with the service

    23

    Webinars and seminars provided for DLR Analytics™ users worldwide 

    Lastly, sign up to receive our news