Transparency
How do you justify the decisions your bank makes? Do you have easy access to evidence to back them up?

DLR Analytics gives central banks the tools they need to make
evidence-based decisions for a better-managed, more efficient
and more cost-effective cash cycle.
Increasingly, central banks are facing pressure to provide transparency and quantify their decision-making. Something that's easier said than done with traditional methods of cash cycle management.

How do you justify the decisions your bank makes? Do you have easy access to evidence to back them up?
Say goodbye to educated guesswork. DLR Analytics gives you data-driven insights to quantify your decisions.
How can you better forecast demand? Do you have the right denominations in the right place at the right time? What forecasting model is the right one to use?
Advanced statistical methods and popular central bank forecasting models combine to give you greater confidence in your banknote demand forecasting.
Do you have a clear picture of what's happening in your cash cycle? What are the main reasons for failure in circulation?
DLR Analytics helps you understand how changes will affect your cash cycle and the life of your notes. Users can see how analogous changes have impacted other central banks.
How can you check whether you are operating within regional norms? Why has something worked in another country but not yours? How do you collaborate with other central banks more effectively?
DLR Analytics provides a standardised mathematical approach and language to enable better knowledge exchange and benchmarking. Global and regional aggregated, anonymised data lets you carry out comparisons of your data with others in the region.
Over 65 central banks are trying a better approach with DLR Analytics, which has recently been awarded the Central Banking Award for Consultancy and advisory provider of the year (currency management)

Using advanced statistical analysis tools, DLR Analytics gives you the insight you need to help you answer your most-asked questions, make better-informed decisions and dramatically improve your cash cycle.

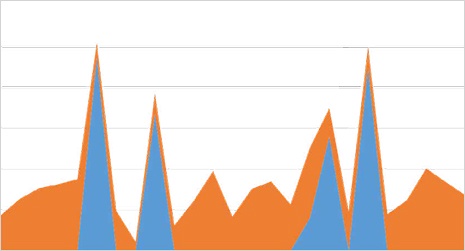
What’s happening to banknote issuance patterns around the world?
Understanding your issuance patterns can help with forecasting and understanding banknote lifetimes.
Step 1
Arrange a demo to see how it can help you
Step 2
Set up your account
Step 3
Add your cash cycle data to the portal every month
Step 4
DLR Analytics generates your tailored reports
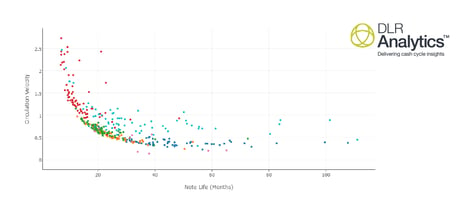
Sort your notes often enough that you can remove them from circulation when they are past their useful life. This analysis helps you balance circulation velocity (or return frequency) with note life.
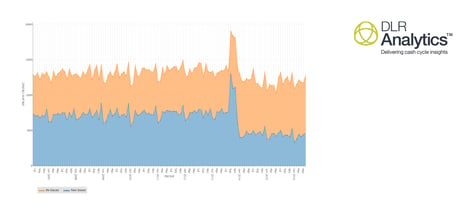
See what affect changes will have on issuance demand, explore how changes of specification and clean note policy has impacted other central banks.
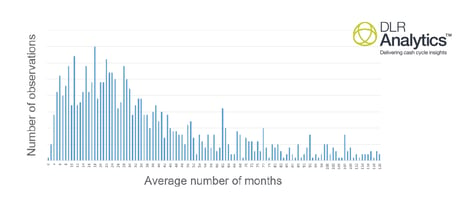
See your data in its global and regional context to help you ask the right questions. Learn from your peers and their decisions. Put your data into a global or regional context. Benchmark yourselves and understand your position.
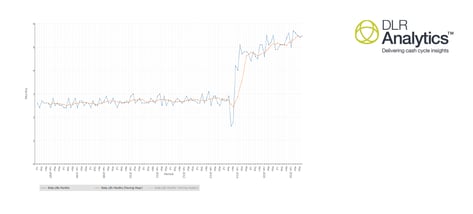
Being able to visualise note life helps you understand if you are going through any type of transition so you can make more accurate demand forecasts and measure how well specification changes perform in your cash cycle.

Once you’ve signed up to DLR Analytics, you’ll automatically become a member of the Cash Cycle Partnership, a supportive community of DLR Analytics users.
As a Cash Cycle Partnership member, you’ll get access to aggregated, anonymised data which shows global and regional trends and norms, the impact of historical changes and a review of how external factors affect overall performance
| Monthly webinars | |
| Access to the online user group and members’ app |
| Annual seminars | |
 |
Analytical support for questions about your cash cycle |
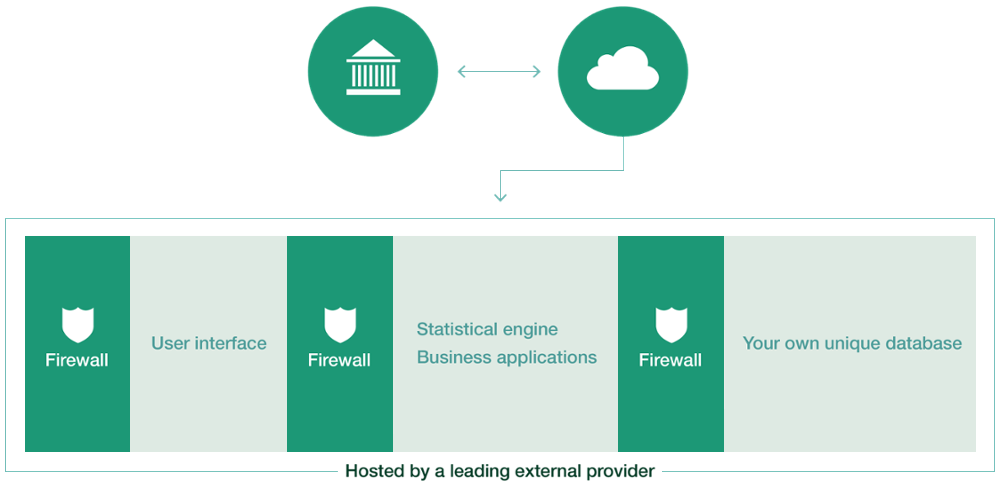
We know that data security is essential and we’re completely confident that your data within DLR Analytics is secure.
We employ professional hackers for regular penetration testing of DLR Analytics and their recommendations to ensure that your data remains secure and we remain on top of the latest security threats.


"Analytics has added value to what we are doing and perhaps given us a whole new dimension to our role as well: we can easily extract the information we require from Analytics, interpret the graphical illustrations etc. I think the difference is that we now interact a lot with the system which adds value to what we are currently doing."
Daniel Haridi, Chief Manager of Currency and the Banking Operations Department at Central Bank of Solomon Islands
"The model comes in handy to assess the life expectancy and manage the stocks. It is very useful to plan and reorder quantities."
Ravi Kamoda, Currency Manager at the Reserve Bank of Fiji
"DLR allows you to see trends in other countries that are in the same situation as you or further on down the line."
Peter Balke, Senior Policy Adviser at the Netherlands Bank
"DLR Analytics provides central banks with an invaluable way of forecasting the future demand for cash – an issue ever-more prevalent, given the rise of digital payments. The software proves substantial value can be taken from simpler aggregated data, reducing the costs for central banks investigating its cash’s lifecycle."
To find out how DLR Analytics could help you run your cash cycle more
efficiently, talk to us about setting up a demo at your offices or online.
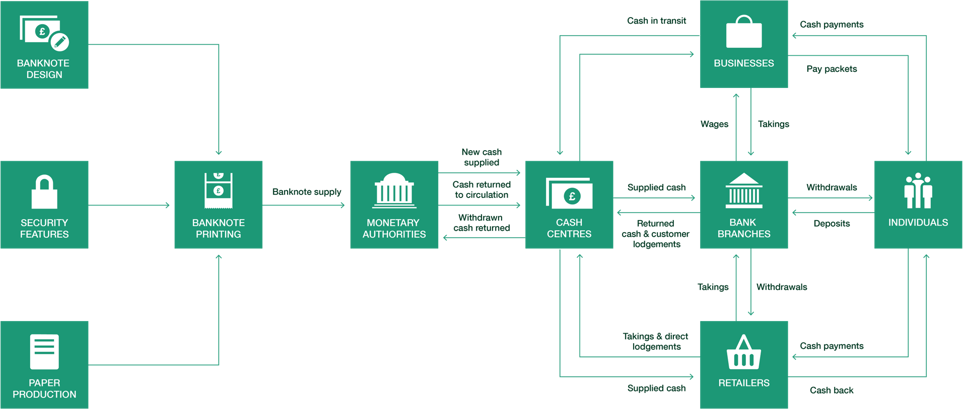
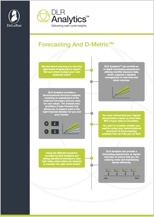
Learn how in-depth forecasting can help ensure you have the right levels and denominations of notes in stock.
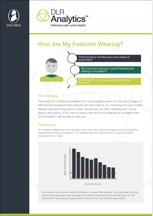
Assess how current features are performing by contacting the DLR Analytics team about their bespoke sorter analytics.
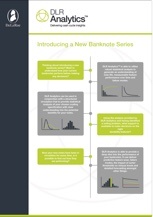
Here's how DLR Analytics can help you understand how your notes are performing and where you can make changes.
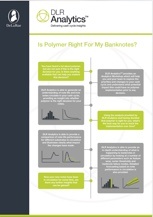
See how DLR Analytics can help you make an informed decision about polymer by monitoring how your notes are performing.
© De La Rue plc 2020